18.1集成学习概述
集成学习的原理正如盲人摸象这个古代寓言所揭示的道理类似:一群盲人第一次遇到大象,想要通过触觉来了解大象。每个人都摸到大象身体的不同部位。但只摸到不同部分,比如鼻子或一条腿。这些人描述的大象是这样的:“它像一条蛇”,“像一根柱子或一棵树”,等等。这些盲人就好比机器学习模型,每个人都是根据自己的假设,并从自己的角度来理解训练数据的多面性。每个人都得到真相的一部分,但不是全部真相。将他们的观点汇集在一起,你就可以得到对数据更加准确的描述。大象是多个部分的组合,每个盲人说的都不完全准确,但综合起来就成了一个相当准确的观点。
集成学习(ensemble learning)可以说是现在非常火爆的机器学习方法了。目前,集成方法在许多著名的机器学习比赛(如 Netflix、KDD 2009 和 Kaggle 比赛)中能够取得很好的名次。
集成学习本身不是一个单独的机器学习算法,而是通过构建并结合多个机器学习器来完成学习任务。也就是我们常说的“博采众长”。集成学习可以用于分类问题集成,回归问题集成,特征选取集成,异常点检测集成等等,可以说所有的机器学习领域都可以看到集成学习的身影。
集成学习的主要思想:对于一个比较复杂的任务,综合许多人的意见来进行决策往往比一家独大好,正所谓集思广益。其过程如下:

一般来说集成学习可以分为三大类:
①用于减少方差的bagging(方差描述的是预测值作为随机变量的离散程度)
②用于减少偏差的boosting(偏差描述的是预测值和真实值之间的差异,即提高拟合能力)
③用于提升预测效果的stacking
18.1.1 Bagging
Bagging是引导聚合的意思。减少一个估计方差的一种方式就是对多个估计进行平均。
Bagging使用装袋采样来获取数据子集训练基础学习器。通常分类任务使用投票的方式集成,而回归任务通过平均的方式集成。
给定一个大小为n的训练集 D,Bagging算法从中均匀、有放回地选出 m个大小为 n' 的子集Di,作为新的训练集。在这 m个训练集上使用分类、回归等算法,则可得到 m个模型,再通过取平均值、取多数票等方法综合产生预测结果,即可得到Bagging的结果。具体如下图:
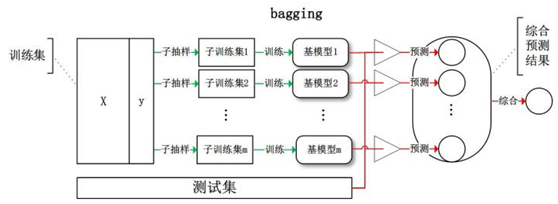
对于Bagging需要注意的是,每次训练集可以取全部的特征进行训练,也可以随机选取部分特征训练,例如随机森林就是每次随机选取部分特征。
常用的集成算法模型是随机森林和随机树等。
在随机森林中,每个树模型都是装袋采样训练的。另外,特征也是随机选择的,最后对于训练好的树也是随机选择的。
这种处理的结果是随机森林的偏差增加的很少,而由于弱相关树模型的平均,方差也得以降低,最终得到一个方差小,偏差也小的模型。

18.1.2 boosting
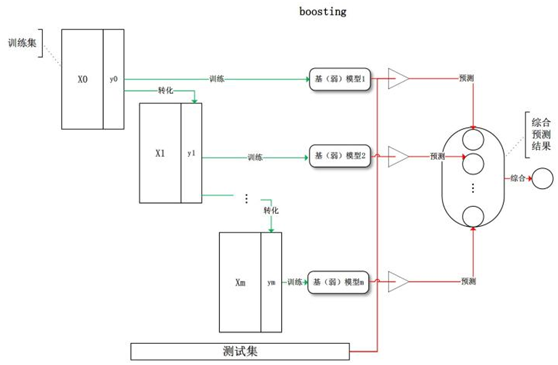
Boosting指的是通过算法集合将弱学习器转换为强学习器。boosting的主要原则是训练一系列的弱学习器,所谓弱学习器是指仅比随机猜测好一点点的模型,例如较小的决策树,训练的方式是利用加权的数据。在训练的早期对于错分数据给予较大的权重。
对于训练好的弱分类器,如果是分类任务按照权重进行投票,而对于回归任务进行加权,然后再进行预测。boosting和bagging的区别在于是对加权后的数据利用弱分类器依次进行训练。
boosting是一族可将弱学习器提升为强学习器的算法,这族算法的工作机制类似:
(1)先从初始训练集训练出一个基学习器;
(2)再根据基学习器的表现对训练样本分布进行调整,使得先前基学习器做错的训练样本在后续受到更多关注;
(3)基于调整后的样本分布来训练下一个基学习器;
(4)重复进行上述步骤,直至基学习器数目达到事先指定的值T,最终将这T个基学习器进行加权结合。具体步骤如下图
如果上面这个图还不太直观,大家可参考以下简单示例:
1、假设我们有如下样本图:
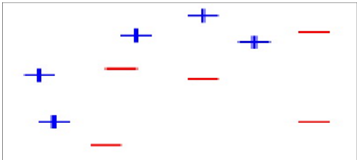
图1
2、第一次分类
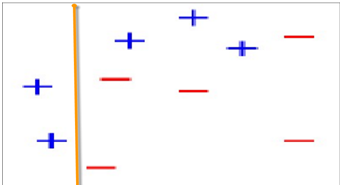
图2
第2次分类
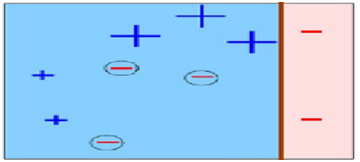
图3
在图2中被正确测的点有较小的权重(尺寸较小),而被预测错误的点(+)则有较大的权重(尺寸较大)
第3次分类
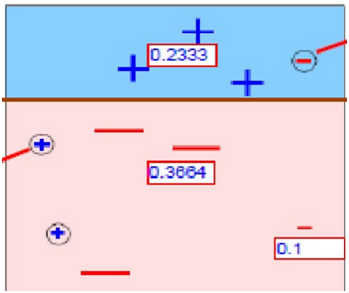
图4
在图3中被正确测的点有较小的权重(尺寸较小),而被预测错误的点(-)则有较大的权重(尺寸较大)。
第4次综合以上分类
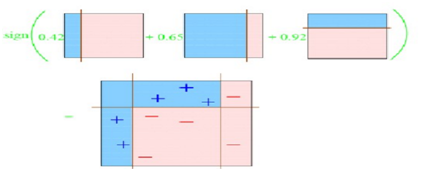
下面描述的算法是最常用的一种boosting算法,叫做AdaBoost,表示自适应boosting。
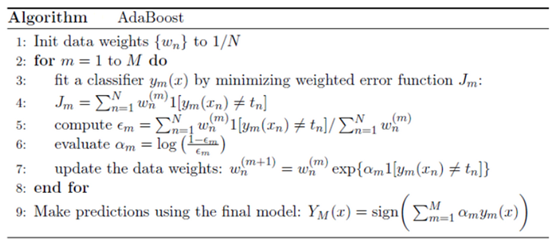
AdaBoost算法每一轮都要判断当前基学习器是否满足条件,一旦条件不满足,则当前学习器被抛弃,且学习过程停止。
AdaBoost算法中的个体学习器存在着强依赖关系,应用的是串行生成的序列化方法。每一个基生成器的目标,都是为了最小化损失函数。所以,可以说AdaBoost算法注重减小偏差。
由于属于boosting算法族,采用的是加性模型,对每个基学习器的输出结果加权处理,只会得到一个输出预测结果。所以标准的AdaBoost只适用于二分类任务。基于Boosting思想的除AdaBoost外,还有GBDT、XGBoost等。
18.1.3 Stacking
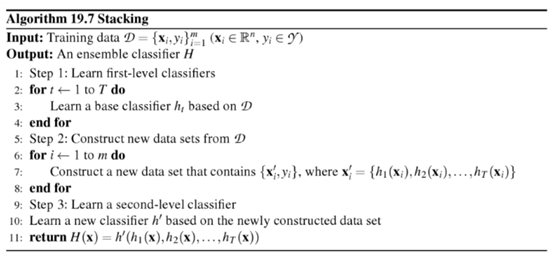
将训练好的所有基模型对训练基进行预测,第j个基模型对第i个训练样本的预测值(概率值或标签)将作为新的训练集中第i个样本的第j个特征值,最后基于新的训练集进行训练。同理,预测的过程也要先经过所有基模型的预测形成新的测试集,最后再对测试集进行预测。如下图所示。
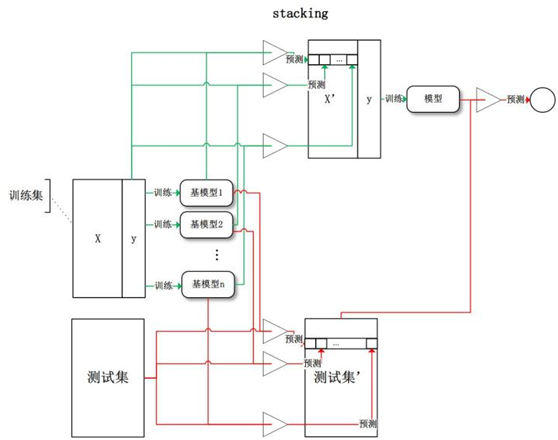
上图可简化为:
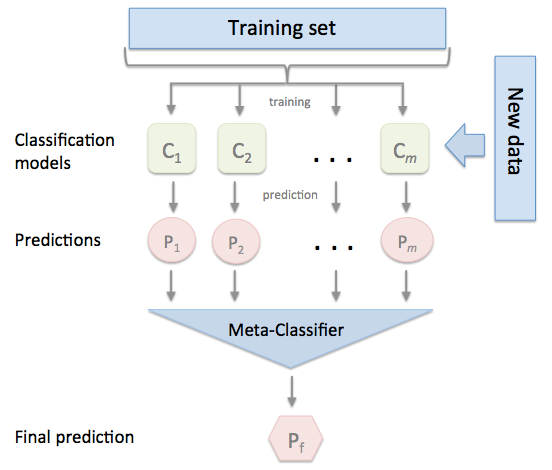
其中Meta-Classifier在实际应用中通常使用单层logistic回归模型。
具体算法为:
18.1.3 .1Stacking中元分类层
为何要Meta-Classifier层?设置该层的目的是啥?其原理是什么?等等或许你还不很清楚,没关系。你看了下面这个说明或许就清楚多了。
让我们假设有三个学生名为LR,SVM,KNN,他们争论一个物理问题,他们对正确的答案可能有不同的看法:
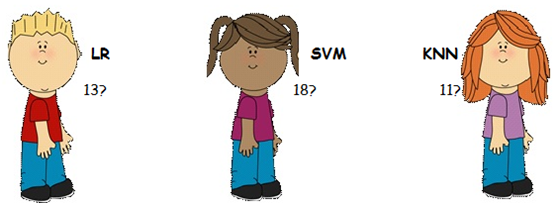
他们认为没有办法相互说服他们的情况,他们通过平均估计他们做民主的事情,这个案例是14.他们使用了最简单的集合形式-AKA模型平均。
他们的老师,DL小姐 - 一位数学老师 - 见证了学生们所拥有的论点并决定提供帮助。她问“问题是什么?”,但是学生们拒绝告诉她(因为他们知道提供所有信息对他们不利,除了他们认为她可能会觉得愚蠢他们在争论这么微不足道的事情)。然而,他们确实告诉她这是一个与物理相关的论点。
在这种情况下,教师无法访问初始数据,因为她不知道问题是什么。然而,她确实非常了解学生 - 他们的优点和缺点,她决定她仍然可以帮助解决这个问题。使用历史信息,了解学生过去的表现,以及她知道SVM喜欢物理并且在这个课程中表现优异的事实(加上她的父亲在青年科学家的物理学院工作),她认为最多适当的答案会更像17。
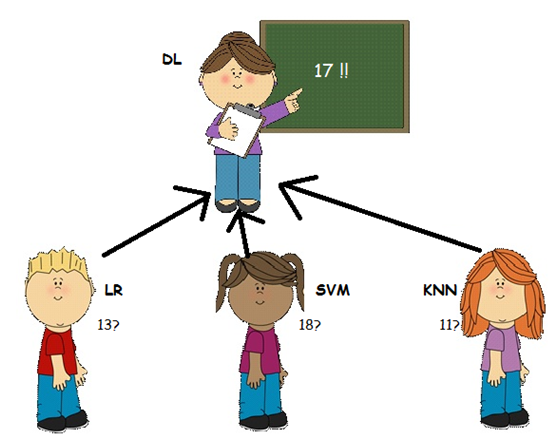
在这种情况下,教师(DL)是元学习者。她使用其他模型(学生)输出的结果作为输入数据。然后,她将其与历史信息结合起来,了解学生过去的表现,以便更好地估计(并帮助解决冲突)。
然而......物理老师RF先生的意见略有不同。他一直在那里,但他一直等到这一刻才行动! RF先生最近一直在教授LR私人物理课程,以提高他的成绩(错过DL不知道的事情),他认为LR对最终估计的贡献应该更大。因此他声称正确的答案更像是16!
在这种情况下,RF先生也是一个元学习者,他用不同的逻辑处理历史数据 - 他可以访问比DL小姐更多的来源(或不同的历史信息)。
只有校长GBM做出决定,才能解决此争议! GBM不知道孩子们说了什么,但他很了解他的老师,他更热衷于信任他的物理老师(RF)。他总结答案更像是16.2。
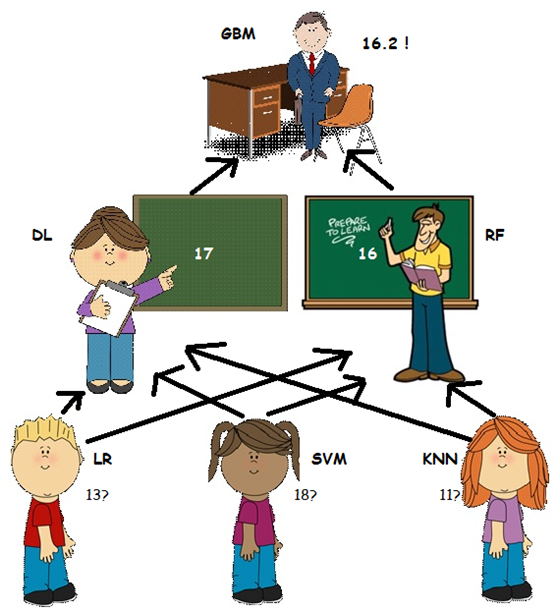
在这种情况下,校长是元级学习者或元学习者的元学习者,并且通过处理他的老师的历史信息,他仍然可以提供比他们的结果的简单平均值更好的估计。
参考文档:
http://blog.kaggle.com/2017/06/15/stacking-made-easy-an-introduction-to-stacknet-by-competitions-grandmaster-marios-michailidis-kazanova/
18.1.3.2Stacking的几种方法
1) 使用分类器产生的特征输出作为meta-classifier的输入
基本使用方法就是,使用前面分类器产生的特征输出作为最后总的meta-classifier的输入数据,以下为利用stacking的基本使用方法实例。
(1)生成数据
|
|
from sklearn import datasets iris = datasets.load_iris() X, y = iris.data[:, 1:3], iris.target |
(2)导入需要的库
|
|
from sklearn import model_selection from sklearn.linear_model import LogisticRegression from sklearn.neighbors import KNeighborsClassifier from sklearn.naive_bayes import GaussianNB from sklearn.ensemble import RandomForestClassifier from mlxtend.classifier import StackingClassifier import numpy as np |
(3)训练各种基模型
1 2 3 4 5 6 7 8 9 10 11 12 13 14 15 16 17 18 19 |
clf1 = KNeighborsClassifier(n_neighbors=1) clf2 = RandomForestClassifier(random_state=1) clf3 = GaussianNB() lr = LogisticRegression() sclf = StackingClassifier(classifiers=[clf1, clf2, clf3], meta_classifier=lr) print('3-fold cross validation:\n') for clf, label in zip([clf1, clf2, clf3, sclf], ['KNN', 'Random Forest', 'Naive Bayes', 'StackingClassifier']): scores = model_selection.cross_val_score(clf, X, y, cv=3, scoring='accuracy') print("Accuracy: %0.2f (+/- %0.2f) [%s]" % (scores.mean(), scores.std(), label)) |
运行结果
3-fold cross validation:
Accuracy: 0.91 (+/- 0.01) [KNN]
Accuracy: 0.91 (+/- 0.06) [Random Forest]
Accuracy: 0.92 (+/- 0.03) [Naive Bayes]
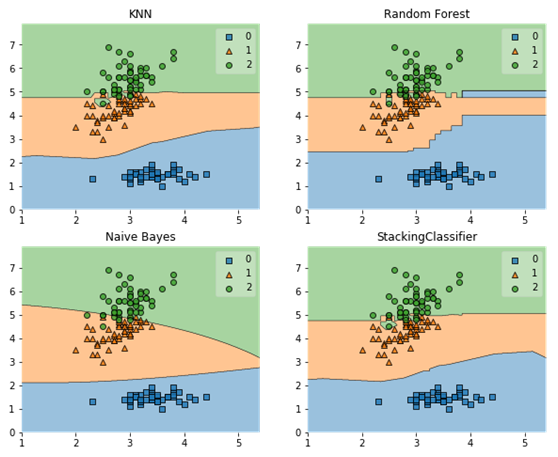
Accuracy: 0.95 (+/- 0.03) [StackingClassifier]
(4)可视化结果
1 2 3 4 5 6 7 8 9 10 11 12 13 14 15 16 17 18 19 20 21 22 |
%matplotlib inline import matplotlib.pyplot as plt from mlxtend.plotting import plot_decision_regions import matplotlib.gridspec as gridspec import itertools gs = gridspec.GridSpec(2, 2) fig = plt.figure(figsize=(10,8)) for clf, lab, grd in zip([clf1, clf2, clf3, sclf], ['KNN', 'Random Forest', 'Naive Bayes', 'StackingClassifier'], itertools.product([0, 1], repeat=2)): clf.fit(X, y) ax = plt.subplot(gs[grd[0], grd[1]]) fig = plot_decision_regions(X=X, y=y, clf=clf) plt.title(lab) |
运行结果
使用网格方法选择超参数
1 2 3 4 5 6 7 8 9 10 11 12 13 14 15 16 17 18 19 20 21 22 23 24 25 26 27 28 29 30 31 32 33 34 35 36 |
from sklearn.linear_model import LogisticRegression from sklearn.neighbors import KNeighborsClassifier from sklearn.naive_bayes import GaussianNB from sklearn.ensemble import RandomForestClassifier from sklearn.model_selection import GridSearchCV from mlxtend.classifier import StackingClassifier # Initializing models clf1 = KNeighborsClassifier(n_neighbors=1) clf2 = RandomForestClassifier(random_state=1) clf3 = GaussianNB() lr = LogisticRegression() sclf = StackingClassifier(classifiers=[clf1, clf2, clf3], meta_classifier=lr) params = {'kneighborsclassifier__n_neighbors': [1, 5], 'randomforestclassifier__n_estimators': [10, 50], 'meta-logisticregression__C': [0.1, 10.0]} grid = GridSearchCV(estimator=sclf, param_grid=params, cv=5, refit=True) grid.fit(X, y) cv_keys = ('mean_test_score', 'std_test_score', 'params') for r, _ in enumerate(grid.cv_results_['mean_test_score']): print("%0.3f +/- %0.2f %r" % (grid.cv_results_[cv_keys[0]][r], grid.cv_results_[cv_keys[1]][r] / 2.0, grid.cv_results_[cv_keys[2]][r])) print('Best parameters: %s' % grid.best_params_) print('Accuracy: %.2f' % grid.best_score_) |
运行结果
0.667 +/- 0.00 {'kneighborsclassifier__n_neighbors': 1, 'meta-logisticregression__C': 0.1, 'randomforestclassifier__n_estimators': 10}
0.667 +/- 0.00 {'kneighborsclassifier__n_neighbors': 1, 'meta-logisticregression__C': 0.1, 'randomforestclassifier__n_estimators': 50}
0.927 +/- 0.02 {'kneighborsclassifier__n_neighbors': 1, 'meta-logisticregression__C': 10.0, 'randomforestclassifier__n_estimators': 10}
0.913 +/- 0.03 {'kneighborsclassifier__n_neighbors': 1, 'meta-logisticregression__C': 10.0, 'randomforestclassifier__n_estimators': 50}
0.667 +/- 0.00 {'kneighborsclassifier__n_neighbors': 5, 'meta-logisticregression__C': 0.1, 'randomforestclassifier__n_estimators': 10}
0.667 +/- 0.00 {'kneighborsclassifier__n_neighbors': 5, 'meta-logisticregression__C': 0.1, 'randomforestclassifier__n_estimators': 50}
0.933 +/- 0.02 {'kneighborsclassifier__n_neighbors': 5, 'meta-logisticregression__C': 10.0, 'randomforestclassifier__n_estimators': 10}
0.940 +/- 0.02 {'kneighborsclassifier__n_neighbors': 5, 'meta-logisticregression__C': 10.0, 'randomforestclassifier__n_estimators': 50}
Best parameters: {'kneighborsclassifier__n_neighbors': 5, 'meta-logisticregression__C': 10.0, 'randomforestclassifier__n_estimators': 50}
Accuracy: 0.94
2)使用类别概率值作为meta-classfier的输入
另一种使用第一层基本分类器产生的类别概率值作为meta-classfier的输入,这种情况下需要将StackingClassifier的参数设置为 use_probas=True。如果将参数设置为 average_probas=True,那么这些基分类器对每一个类别产生的概率值会被平均,否则会拼接。
例如有两个基分类器产生的概率输出为:
classifier 1: [0.2, 0.5, 0.3]
classifier 2: [0.3, 0.4, 0.4]
1) average = True :
产生的meta-feature 为:[0.25, 0.45, 0.35]
2) average = False:
产生的meta-feature为:[0.2, 0.5, 0.3, 0.3, 0.4, 0.4]
以下为具体实例
1 2 3 4 5 6 7 8 9 10 11 12 13 14 15 16 17 18 19 20 21 22 23 24 25 26 27 28 29 30 31 32 33 34 |
from sklearn import datasets iris = datasets.load_iris() X, y = iris.data[:, 1:3], iris.target from sklearn import model_selection from sklearn.linear_model import LogisticRegression from sklearn.neighbors import KNeighborsClassifier from sklearn.naive_bayes import GaussianNB from sklearn.ensemble import RandomForestClassifier from mlxtend.classifier import StackingClassifier import numpy as np clf1 = KNeighborsClassifier(n_neighbors=1) clf2 = RandomForestClassifier(random_state=1) clf3 = GaussianNB() lr = LogisticRegression() sclf = StackingClassifier(classifiers=[clf1, clf2, clf3], use_probas=True, average_probas=False, meta_classifier=lr) print('3-fold cross validation:\n') for clf, label in zip([clf1, clf2, clf3, sclf], ['KNN', 'Random Forest', 'Naive Bayes', 'StackingClassifier']): scores = model_selection.cross_val_score(clf, X, y, cv=3, scoring='accuracy') print("Accuracy: %0.2f (+/- %0.2f) [%s]" % (scores.mean(), scores.std(), label)) |
运行结果
3-fold cross validation:
Accuracy: 0.91 (+/- 0.01) [KNN]
Accuracy: 0.91 (+/- 0.06) [Random Forest]
Accuracy: 0.92 (+/- 0.03) [Naive Bayes]
Accuracy: 0.94 (+/- 0.03) [StackingClassifier]
显然,用stacking方法的精度(Accuracy: 0.94)明显好于单个模型的精度。
3)使用堆叠分类及网格搜索
使用堆叠分类及网格搜索(Stacked Classification and GridSearch)方法,要为scikit-learn网格搜索设置参数网格,我们只需在参数网格中提供估算器的名称 - 在meta-regressor的特殊情况下,我们附加'meta-'前缀即可,以下为代码实例。
1 2 3 4 5 6 7 8 9 10 11 12 13 14 15 16 17 18 19 20 21 22 23 24 25 26 27 28 29 30 31 32 33 34 35 36 |
from sklearn.linear_model import LogisticRegression from sklearn.neighbors import KNeighborsClassifier from sklearn.naive_bayes import GaussianNB from sklearn.ensemble import RandomForestClassifier from sklearn.model_selection import GridSearchCV from mlxtend.classifier import StackingClassifier # Initializing models clf1 = KNeighborsClassifier(n_neighbors=1) clf2 = RandomForestClassifier(random_state=1) clf3 = GaussianNB() lr = LogisticRegression() sclf = StackingClassifier(classifiers=[clf1, clf2, clf3], meta_classifier=lr) params = {'kneighborsclassifier__n_neighbors': [1, 5], 'randomforestclassifier__n_estimators': [10, 50], 'meta-logisticregression__C': [0.1, 10.0]} grid = GridSearchCV(estimator=sclf, param_grid=params, cv=5, refit=True) grid.fit(X, y) cv_keys = ('mean_test_score', 'std_test_score', 'params') for r, _ in enumerate(grid.cv_results_['mean_test_score']): print("%0.3f +/- %0.2f %r" % (grid.cv_results_[cv_keys[0]][r], grid.cv_results_[cv_keys[1]][r] / 2.0, grid.cv_results_[cv_keys[2]][r])) print('Best parameters: %s' % grid.best_params_) print('Accuracy: %.2f' % grid.best_score_) |
运行结果
0.667 +/- 0.00 {'kneighborsclassifier__n_neighbors': 1, 'meta-logisticregression__C': 0.1, 'randomforestclassifier__n_estimators': 10}
0.667 +/- 0.00 {'kneighborsclassifier__n_neighbors': 1, 'meta-logisticregression__C': 0.1, 'randomforestclassifier__n_estimators': 50}
0.967 +/- 0.01 {'kneighborsclassifier__n_neighbors': 1, 'meta-logisticregression__C': 10.0, 'randomforestclassifier__n_estimators': 10}
0.967 +/- 0.01 {'kneighborsclassifier__n_neighbors': 1, 'meta-logisticregression__C': 10.0, 'randomforestclassifier__n_estimators': 50}
0.667 +/- 0.00 {'kneighborsclassifier__n_neighbors': 5, 'meta-logisticregression__C': 0.1, 'randomforestclassifier__n_estimators': 10}
0.667 +/- 0.00 {'kneighborsclassifier__n_neighbors': 5, 'meta-logisticregression__C': 0.1, 'randomforestclassifier__n_estimators': 50}
0.967 +/- 0.01 {'kneighborsclassifier__n_neighbors': 5, 'meta-logisticregression__C': 10.0, 'randomforestclassifier__n_estimators': 10}
0.967 +/- 0.01 {'kneighborsclassifier__n_neighbors': 5, 'meta-logisticregression__C': 10.0, 'randomforestclassifier__n_estimators': 50}
Best parameters: {'kneighborsclassifier__n_neighbors': 1, 'meta-logisticregression__C': 10.0, 'randomforestclassifier__n_estimators': 10}
Accuracy: 0.97
最一句是各参数最佳匹配模型的结果,显然,这个精度高于其他情况的精度。
如果我们计划多次使用回归算法,我们需要做的就是在参数网格中添加一个额外的数字后缀,如下所示:
1 2 3 4 5 6 7 8 9 10 11 12 13 14 15 16 17 18 19 20 21 22 23 24 25 26 27 28 29 30 31 32 |
from sklearn.model_selection import GridSearchCV # Initializing models clf1 = KNeighborsClassifier(n_neighbors=1) clf2 = RandomForestClassifier(random_state=1) clf3 = GaussianNB() lr = LogisticRegression() sclf = StackingClassifier(classifiers=[clf1, clf1, clf2, clf3], meta_classifier=lr) params = {'kneighborsclassifier-1__n_neighbors': [1, 5], 'kneighborsclassifier-2__n_neighbors': [1, 5], 'randomforestclassifier__n_estimators': [10, 50], 'meta-logisticregression__C': [0.1, 10.0]} grid = GridSearchCV(estimator=sclf, param_grid=params, cv=5, refit=True) grid.fit(X, y) cv_keys = ('mean_test_score', 'std_test_score', 'params') for r, _ in enumerate(grid.cv_results_['mean_test_score']): print("%0.3f +/- %0.2f %r" % (grid.cv_results_[cv_keys[0]][r], grid.cv_results_[cv_keys[1]][r] / 2.0, grid.cv_results_[cv_keys[2]][r])) print('Best parameters: %s' % grid.best_params_) print('Accuracy: %.2f' % grid.best_score_) |
运行结果
0.667 +/- 0.00 {'kneighborsclassifier-1__n_neighbors': 1, 'kneighborsclassifier-2__n_neighbors': 1, 'meta-logisticregression__C': 0.1, 'randomforestclassifier__n_estimators': 10}
0.667 +/- 0.00 {'kneighborsclassifier-1__n_neighbors': 1, 'kneighborsclassifier-2__n_neighbors': 1, 'meta-logisticregression__C': 0.1, 'randomforestclassifier__n_estimators': 50}
0.967 +/- 0.01 {'kneighborsclassifier-1__n_neighbors': 1, 'kneighborsclassifier-....
0.667 +/- 0.00 {'kneighborsclassifier-1__n_neighbors': 5, 'kneighborsclassifier-2__n_neighbors': 1, 'meta-logisticregression__C': 0.1, 'randomforestclassifier__n_estimators': 50}
0.967 +/- 0.01 {'kneighborsclassifier-1__n_neighbors': 5, 'kneighborsclassifier-2__n_neighbors': 1, 'meta-logisticregression__C': 10.0, 'randomforestclassifier__n_estimators': 10}
.......................................
0.967 +/- 0.01 {'kneighborsclassifier-1__n_neighbors': 5, 'kneighborsclassifier-2__n_neighbors': 5, 'meta-logisticregression__C': 10.0, 'randomforestclassifier__n_estimators': 50}
Best parameters: {'kneighborsclassifier-1__n_neighbors': 1, 'kneighborsclassifier-2__n_neighbors': 1, 'meta-logisticregression__C': 10.0, 'randomforestclassifier__n_estimators': 10}
Accuracy: 0.97
StackingClassifier还可以对分类器参数进行网格搜索。 但是,由于目前scikit-learn中GridSearchCV的实现,不可能同时搜索不同分类器和分类器参数。 例如,虽然以下参数字典有效。
4)给不同及分类器不同特征
给不同及分类器不同特征是对训练基中的特征维度进行操作的,这次不是给每一个基分类器全部的特征,而是给不同的基分类器分不同的特征,即比如基分类器1训练前半部分特征,基分类器2训练后半部分特征(可以通过sklearn 的pipelines 实现)。最终通过StackingClassifier组合起来。以下为代码实例。
1 2 3 4 5 6 7 8 9 10 11 12 13 14 15 16 17 18 19 |
from sklearn.datasets import load_iris from mlxtend.classifier import StackingClassifier from mlxtend.feature_selection import ColumnSelector from sklearn.pipeline import make_pipeline from sklearn.linear_model import LogisticRegression iris = load_iris() X = iris.data y = iris.target pipe1 = make_pipeline(ColumnSelector(cols=(0, 2)), LogisticRegression()) pipe2 = make_pipeline(ColumnSelector(cols=(1, 2, 3)), LogisticRegression()) sclf = StackingClassifier(classifiers=[pipe1, pipe2], meta_classifier=LogisticRegression()) sclf.fit(X, y) |
参考文档:
https://rasbt.github.io/mlxtend/user_guide/classifier/StackingClassifier/
18.2投票分类器(VotingClassifier)
投票分类器的原理是结合了多个不同的机器学习分类器,使用多数票或者平均预测概率(软票),预测类标签。这类分类器对一组相同表现的模型十分有用,同时可以平衡各自的弱点。投票分类又可进一步分为多数投票分类(Majority Class Labels)、加权平均概率(soft vote,软投票)。
18.2.1多数投票分类(MajorityVote Class)
多数投票分类的分类原则为预测标签不同时,按最多种类为最终分类;如果预测标签相同时,则按顺序,选择排在第1的标签为最终分类。举例如下:
预测类型的标签为该组学习器中相同最多的种类:例如给出的分类如下
分类器1 -> 标签1
分类器2 -> 标签1
分类器3 -> 标签2
投票分类器(voting=‘hard’)则该预测结果为‘标签1’。
在各个都只有一个的情况下,则按照顺序来,如下:
分类器1 -> 标签2
分类器2 -> 标签1
最终分类结果为“标签2”
18.2.1.1Iris数据集概述
首先,我们取得数据,下面这个链接中有数据的详细介绍,并可以下载数据集。https://archive.ics.uci.edu/ml/datasets/Iris
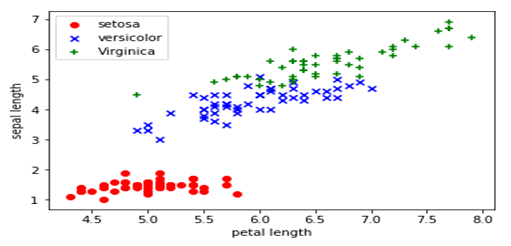
从数据的说明上,我们可以看到Iris有4个特征,3个类别。但是,我们为了数据的可视化,我们只保留2个特征(sepal length和petal length)。数据可视化代码如下:
1 2 3 4 5 6 7 8 9 10 11 12 13 14 15 16 17 |
%matplotlib inline import pandas as pd import matplotlib.pylab as plt import numpy as np # 加载Iris数据集作为DataFrame对象 df = pd.read_csv('http://archive.ics.uci.edu/ml/machine-learning-databases/iris/iris.data', header=None) X = df.iloc[:, [0, 2]].values # 取出2个特征,并把它们用Numpy数组表示 plt.scatter(X[:50, 0], X[:50, 1],color='red', marker='o', label='setosa') # 前50个样本的散点图 plt.scatter(X[50:100, 0], X[50:100, 1],color='blue', marker='x', label='versicolor') # 中间50个样本的散点图 plt.scatter(X[100:, 0], X[100:, 1],color='green', marker='+', label='Virginica') # 后50个样本的散点图 plt.xlabel('petal length') plt.ylabel('sepal length') plt.legend(loc=2) # 把说明放在左上角,具体请参考官方文档 plt.show() |
示例代码如下:
1 2 3 4 5 6 7 8 9 10 11 12 13 14 15 16 17 18 19 |
from sklearn import datasets from sklearn import cross_validation from sklearn.linear_model import LogisticRegression from sklearn.naive_bayes import GaussianNB from sklearn.ensemble import RandomForestClassifier from sklearn.ensemble import VotingClassifier iris = datasets.load_iris() X, y = iris.data[:, 1:3], iris.target clf1 = LogisticRegression(random_state=1) clf2 = RandomForestClassifier(random_state=1) clf3 = GaussianNB() eclf = VotingClassifier(estimators=[('lr', clf1), ('rf', clf2), ('gnb', clf3)], voting='hard', weights=[2,1,2]) for clf, label in zip([clf1, clf2, clf3, eclf], ['Logistic Regression', 'Random Forest', 'naive Bayes', 'Ensemble']): scores = cross_validation.cross_val_score(clf, X, y, cv=5, scoring='accuracy') print("Accuracy: %0.2f (+/- %0.2f) [%s]" % (scores.mean(), scores.std(), label)) |
运行结果如下:
Accuracy: 0.90 (+/- 0.05) [Logistic Regression]
Accuracy: 0.93 (+/- 0.05) [Random Forest]
Accuracy: 0.91 (+/- 0.04) [naive Bayes]
Accuracy: 0.95 (+/- 0.05) [Ensemble]
18.2.2多数投票分类(MajorityVote Class)
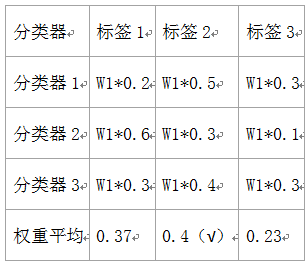
相对于多数投票(hard voting),软投票返回预测概率值的总和最大的标签。可通过参数weights指定每个分类器的权重;若权重提供了,在计算时则会按照权重计算,然后取平均;标签则为概率最高的标签。
举例说明,假设有3个分类器,3个类,每个分类器的权重为:w1=1,w2=1,w3=1。如下表:
下面例子为线性SVM,决策树,K邻近分类器:
1 2 3 4 5 6 7 8 9 10 11 12 13 14 15 16 17 18 19 20 21 22 23 24 25 26 27 28 29 30 31 32 33 34 35 36 37 38 39 40 41 42 |
from sklearn import datasets from sklearn.tree import DecisionTreeClassifier from sklearn.neighbors import KNeighborsClassifier from sklearn.svm import SVC from itertools import product from sklearn.ensemble import VotingClassifier #Loading some example data iris = datasets.load_iris() X = iris.data[:, [0,2]] y = iris.target #Training classifiers clf1 = DecisionTreeClassifier(max_depth=4) clf2 = KNeighborsClassifier(n_neighbors=7) clf3 = SVC(kernel='rbf', probability=True) eclf = VotingClassifier(estimators=[('dt', clf1), ('knn', clf2), ('svc', clf3)], voting='soft', weights=[2,1,2]) clf1 = clf1.fit(X,y) clf2 = clf2.fit(X,y) clf3 = clf3.fit(X,y) eclf = eclf.fit(X,y) ##这些分类器分类结果 x_min,x_max = X[:,0].min()-1,X[:,0].max()+1 y_min,y_max = X[:,1].min()-1,X[:,1].max()+1 xx,yy = np.meshgrid(np.arange(x_min,x_max,0.1), np.arange(y_min,y_max,0.1)) f, axarr = plt.subplots(2, 2, sharex='col', sharey='row', figsize=(10, 8)) for idx, clf, tt in zip(product([0, 1], [0, 1]), [clf1, clf2, clf3, eclf], ['Decision Tree (depth=4)', 'KNN (k=7)', 'Kernel SVM', 'Soft Voting']): Z = clf.predict(np.c_[xx.ravel(), yy.ravel()]) Z = Z.reshape(xx.shape) axarr[idx[0], idx[1]].contourf(xx, yy, Z, alpha=0.4) axarr[idx[0], idx[1]].scatter(X[:, 0], X[:, 1], c=y, alpha=0.8) axarr[idx[0], idx[1]].set_title(tt) plt.show() |

18.3自适应分类器(Adaboost)
Adaboost是一种迭代算法,其核心思想是针对同一个训练集训练不同的分类器(弱分类器),然后把这些弱分类器集合起来,构成一个更强的最终分类器(强分类器)。其算法本身是通过改变数据分布来实现的,它根据每次训练集之中每个样本的分类是否正确,以及上次的总体分类的准确率,来确定每个样本的权值。将修改过权值的新数据集送给下层分类器进行训练,最后将每次训练得到的分类器最后融合起来,作为最后的决策分类器。使用adaboost分类器可以排除一些不必要的训练数据特征,并放在关键的训练数据上面。
下面的例子展示了AdaBoost算法拟合100个弱学习器
|
|
from sklearn.model_selection import cross_val_score from sklearn.datasets import load_iris from sklearn.ensemble import AdaBoostClassifier iris = load_iris() clf = AdaBoostClassifier(n_estimators=100) scores = cross_val_score(clf, iris.data, iris.target) scores.mean() |
输出结果为:
0.95996732026143794
18.4 Xgboost简介
18.4.1简介
Xgboost是很多CART回归树集成,CART树以基尼系数为划分依据。回归树的样本输出是数值的形式,比如给某人发放房屋贷款的数额就是具体的数值,可以是0到120万元之间的任意值。那么,这时候你就没法用上述的信息增益、信息增益率、基尼系数来判定树的节点分裂了,你就会采用新的方式,预测误差,常用的有均方误差、对数误差等。而且节点不再是类别,是数值(预测值),那么怎么确定呢,有的是节点内样本均值,有的是最优化算出来的比如Xgboost。
xgboot特点:
1、w是最优化求出来的
2、使用正则化防止过拟合的技术
3、支持分布式、并行化,树之间没有很强的上下依赖关系
4、支持GPU
下图就是一个CART的例子,CART会把输入根据属性分配到各个也子节点上,而每个叶子节点上面会对应一个分数值。下面的例子是预测一个人是否喜欢电脑游戏。将叶子节点表示为分数之后,可以做很多事情,比如概率预测,排序等等。
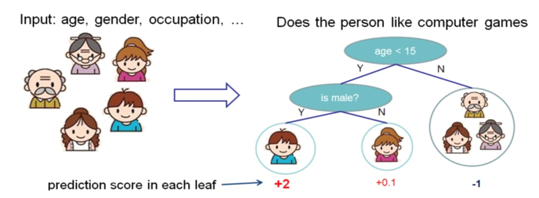
一个CART往往过于简单,而无法有效的进行预测,因此更加高效的是使用多个CART进行融合,使用集成的方法提升预测效率:

假设有两颗回归树,则两棵树融合后的预测结果如上图。
xgboost涉及 参数较多,具体使用可参考:https://cloud.tencent.com/developer/article/1111048
https://blog.csdn.net/han_xiaoyang/article/details/52665396
18.4.2 xgboost 实例
主要目的:利用多种预测方法,对房价进行预测
数据结构:
数据探索与预处理:
创建及优化模型:
18.4.2.1数据探索及数据预处理
(1)导入需要的库,并导入数据,查看前五行样本数据,参考文档:
1 2 3 4 5 6 7 8 9 10 11 12 13 14 15 16 17 18 19 20 21 22 23 24 25 26 27 28 29 30 31 32 33 34 35 36 37 38 39 40 41 42 43 44 45 46 47 48 49 |
#import some necessary librairies import numpy as np # linear algebra import pandas as pd # data processing, CSV file I/O (e.g. pd.read_csv) %matplotlib inline import matplotlib.pyplot as plt # Matlab-style plotting import seaborn as sns color = sns.color_palette() sns.set_style('darkgrid') import warnings def ignore_warn(*args, **kwargs): pass warnings.warn = ignore_warn #ignore annoying warning (from sklearn and seaborn) from scipy import stats from scipy.stats import norm, skew #for some statistics pd.set_option('display.float_format', lambda x: '{:.3f}'.format(x)) #Limiting floats output to 3 decimal points from subprocess import check_output print(check_output(["ls", "../data"]).decode("utf8")) #check the files available in the directory #Now let's import and put the train and test datasets in pandas dataframe train = pd.read_csv('../data/house_train.csv') test = pd.read_csv('../data/house_test.csv') ##display the first five rows of the train dataset. train.head(5) #check the numbers of samples and features print("The train data size before dropping Id feature is : {} ".format(train.shape)) print("The test data size before dropping Id feature is : {} ".format(test.shape)) #Save the 'Id' column train_ID = train['Id'] test_ID = test['Id'] #对原数组直接删除ID列,inplace = True为直接删除原数组. train.drop("Id", axis = 1, inplace = True) test.drop("Id", axis = 1, inplace = True) #check again the data size after dropping the 'Id' variable print("\nThe train data size after dropping Id feature is : {} ".format(train.shape)) print("The test data size after dropping Id feature is : {} ".format(test.shape)) |

The train data size before dropping Id feature is : (1460, 81)
The test data size before dropping Id feature is : (1459, 80)
The train data size after dropping Id feature is : (1460, 80)
The test data size after dropping Id feature is : (1459, 79)
(2)探索孤立点
|
|
fig, ax = plt.subplots() ax.scatter(x = train['GrLivArea'], y = train['SalePrice']) plt.ylabel('SalePrice', fontsize=13) plt.xlabel('GrLivArea', fontsize=13) plt.show() |
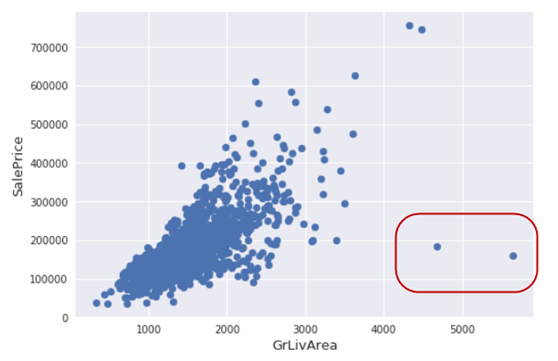
(3)删除一些孤立点
删除房屋销售价(SalePr ice)小于300000(美元)并且居住面积(GrLivArea)平方英尺大于40003的记录。主要是上图中右下边这几个点。
|
|
#Deleting outliers train = train.drop(train[(train['GrLivArea']>4000) & (train['SalePrice']<300000)].index) #Check the graphic again fig, ax = plt.subplots() ax.scatter(train['GrLivArea'], train['SalePrice']) plt.ylabel('SalePrice', fontsize=13) plt.xlabel('GrLivArea', fontsize=13) plt.show() |
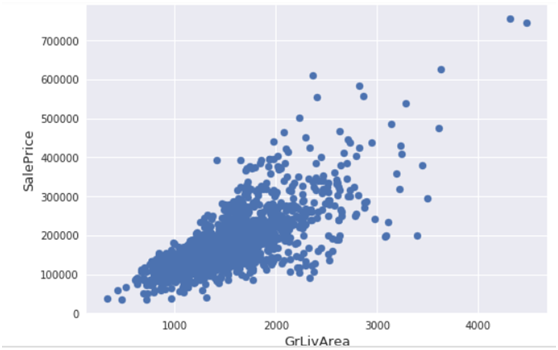
(4)探索房价分布情况
分析目标变量(房价),画出房价分布图及QQ图,QQ图就是分位数图示法(Quantile Quantile Plot,Q-Q图主要用于检验数据分布的相似性,如果要利用Q-Q图来对数据进行正态分布的检验,则可以令x轴为正态分布的分位数,y轴为样本分位数,如果这两者构成的点分布在一条直线上,就证明样本数据与正态分布存在线性相关性,即服从正态分布。
|
|
sns.distplot(train['SalePrice'] , fit=norm); # Get the fitted parameters used by the function (mu, sigma) = norm.fit(train['SalePrice']) print( '\n mu = {:.2f} and sigma = {:.2f}\n'.format(mu, sigma)) #Now plot the distribution plt.legend(['Normal dist. ($\mu=$ {:.2f} and $\sigma=$ {:.2f} )'.format(mu, sigma)], loc='best') plt.ylabel('Frequency') plt.title('SalePrice distribution') #Get also the QQ-plot fig = plt.figure() res = stats.probplot(train['SalePrice'], plot=plt) plt.show() |
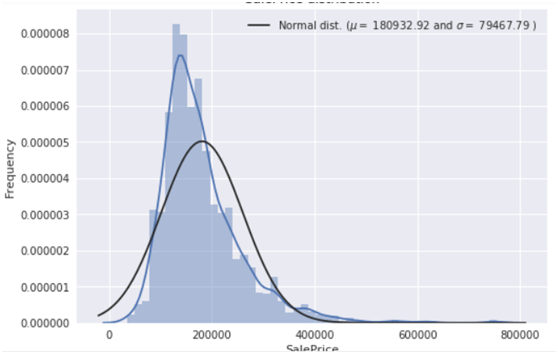
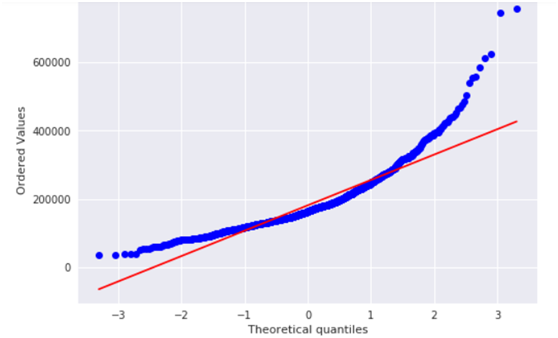
由上图可知,目标变量是右倾斜的。 由于(线性)模型喜欢正态分布的数据,我们需要对房价特征进行转换,使其接近正态分布。
(5)对房价特征进行log转换
1 2 3 4 5 6 7 8 9 10 11 12 13 14 15 16 17 18 19 |
#We use the numpy fuction log1p which applies log(1+x) to all elements of the column train["SalePrice"] = np.log1p(train["SalePrice"]) #Check the new distribution sns.distplot(train['SalePrice'] , fit=norm); # Get the fitted parameters used by the function (mu, sigma) = norm.fit(train['SalePrice']) print( '\n mu = {:.2f} and sigma = {:.2f}\n'.format(mu, sigma)) #Now plot the distribution plt.legend(['Normal dist. ($\mu=$ {:.2f} and $\sigma=$ {:.2f} )'.format(mu, sigma)], loc='best') plt.ylabel('Frequency') plt.title('SalePrice distribution') #Get also the QQ-plot fig = plt.figure() res = stats.probplot(train['SalePrice'], plot=plt) plt.show() |
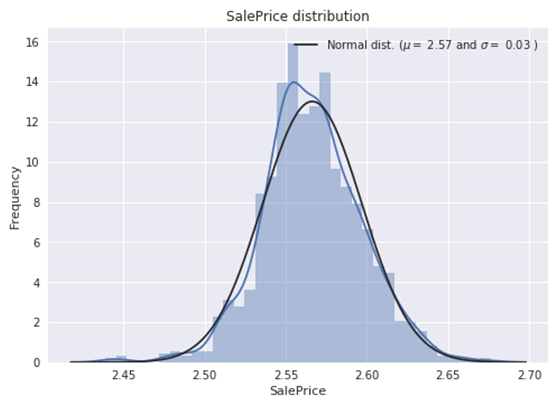

现在纠正了偏差,数据看起来更正常分布。
(6)连接训练数据和测试数据
为便于统一处理,我们需要把训练数据、测试数据集成在一起。对房价数据不做处理。
|
|
ntrain = train.shape[0] ntest = test.shape[0] y_train = train.SalePrice.values #为使合并后的索引正常,加上reset_index all_data = pd.concat((train, test)).reset_index(drop=True) all_data.drop(['SalePrice'], axis=1, inplace=True) print("all_data size is : {}".format(all_data.shape)) |
运行结果:
all_data size is : (2917, 79)
(7)查看缺失数据情况
以下我们查看各特征的缺失率
|
|
all_data_na = (all_data.isnull().sum() / len(all_data)) * 100 all_data_na = all_data_na.drop(all_data_na[all_data_na == 0].index).sort_values(ascending=False)[:30] missing_data = pd.DataFrame({'Missing Ratio' :all_data_na}) missing_data.head(20) |
运行结果
Missing Ratio
PoolQC 99.691
MiscFeature 96.4
Alley 93.212
Fence 80.425
FireplaceQu 48.68
LotFrontage 16.661
GarageQual 5.451
GarageCond 5.451
GarageFinish 5.451
GarageYrBlt 5.451
GarageType 5.382
BsmtExposure 2.811
BsmtCond 2.811
BsmtQual 2.777
BsmtFinType2 2.743
BsmtFinType1 2.708
MasVnrType 0.823
MasVnrArea 0.788
MSZoning 0.137
BsmtFullBath 0.069
可视化这些数据
|
|
f, ax = plt.subplots(figsize=(15, 12)) plt.xticks(rotation='90') sns.barplot(x=all_data_na.index, y=all_data_na) plt.xlabel('Features', fontsize=15) plt.ylabel('Percent of missing values', fontsize=15) plt.title('Percent missing data by feature', fontsize=15) |
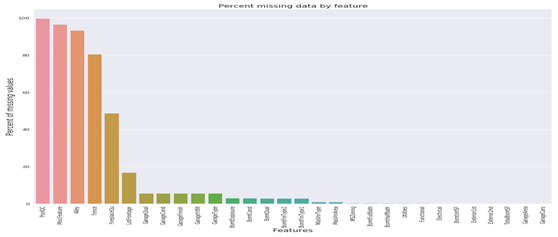
(8)查看数据的相关性
|
|
#Correlation map to see how features are correlated with SalePrice corrmat = train.corr() plt.subplots(figsize=(12,9)) sns.heatmap(corrmat, vmax=0.9, square=True) |

颜色越深,表示相关性越强。
(9)填充缺失值
以下我们对存在缺失值的特征分别进行处理,
PoolQC:数据描述表示NA表示“无池”。 这是有道理的,因为缺失值的比例很大(+ 99%),而且大多数房屋一般都没有游泳池。这里我们把缺失值改为None。
|
|
all_data["PoolQC"] = all_data["PoolQC"].fillna("None") |
MiscFeature:数据描述表示NA表示“没有杂项功能,这里把缺失值改为None
all_data["MiscFeature"] = all_data["MiscFeature"].fillna("None")
类似把特征Alley 、Fence、FireplaceQu、GarageType, GarageFinish, GarageQual and GarageCond,进行相同处理,这些特征的缺失率都比较高。
|
|
for col in ('Alley','Fence','FireplaceQu','GarageType', 'GarageFinish', 'GarageQual', 'GarageCond'): all_data[col] = all_data[col].fillna('None') |
LotFrontage(与街道连接的线性脚):由于连接到房产的每条街道的区域很可能与其附近的其他房屋有相似的区域,我们可以通过邻域的中位数LotFrontage填写缺失值。
|
|
#Group by neighborhood and fill in missing value by the median LotFrontage of all the neighborhood all_data["LotFrontage"] = all_data.groupby("Neighborhood")["LotFrontage"].transform( lambda x: x.fillna(x.median())) |
GarageYrBlt,GarageArea和GarageCars:用0代替缺失数据(因为没有车库=这样的车库没有车辆。)
|
|
for col in ('GarageYrBlt', 'GarageArea', 'GarageCars'): all_data[col] = all_data[col].fillna(0) |
对BsmtFinSF1, BsmtFinSF2, BsmtUnfSF, TotalBsmtSF, BsmtFullBath and BsmtHalfBath, MasVnrArea做同样处理。
|
|
for col in ('BsmtFinSF1', 'BsmtFinSF2', 'BsmtUnfSF','TotalBsmtSF', 'BsmtFullBath', 'BsmtHalfBath','MasVnrArea'): all_data[col] = all_data[col].fillna(0) |
对BsmtQual', 'BsmtCond', 'BsmtExposure', 'BsmtFinType1', 'BsmtFinType2','MasVnrType特征的缺失值改为None。
|
|
for col in ('BsmtQual', 'BsmtCond', 'BsmtExposure', 'BsmtFinType1', 'BsmtFinType2','MasVnrType'): all_data[col] = all_data[col].fillna('None') |
MSZoning(一般分区分类):'RL'是迄今为止最常见的值。 所以我们可以用'RL'来填补缺失值,取频度最大的那个数据,采用mode()[0]的格式。
|
|
all_data['MSZoning'] = all_data['MSZoning'].fillna(all_data['MSZoning'].mode()[0]) |
对特征Electrical,KitchenQual,Exterior1st,Exterior2nd,SaleType做相同处理。
|
|
for col in ('Electrical','KitchenQual','Exterior1st','Exterior2nd','SaleType'): all_data[col] = all_data[col].fillna(all_data[col].mode()[0]) |
Utilities:对于此分类功能,所有记录都是“AllPub”,除了一个“NoSeWa”和2个NA。 由于带有“NoSewa”的房子位于训练集中,因此该功能无助于预测建模。 然后我们可以安全地删除它。
|
|
all_data = all_data.drop(['Utilities'], axis=1) Functional:数据描述说NA意味着典型 all_data["Functional"] = all_data["Functional"].fillna("Typ") MSSubClass:Na很可能意味着没有建筑类。 我们可以用None替换缺失值 |
|
|
all_data['MSSubClass'] = all_data['MSSubClass'].fillna("None") |
通过以上缺失值的填充,我们再看一下缺失情况
|
|
#Check remaining missing values if any all_data_na = (all_data.isnull().sum() / len(all_data)) * 100 all_data_na = all_data_na.drop(all_data_na[all_data_na == 0].index).sort_values(ascending=False) missing_data = pd.DataFrame({'Missing Ratio' :all_data_na}) missing_data.head() |
运行结果为
没有缺失值特征了!
(10)对一些分类的数值特征转换。
这里使用LabelEncoder 对不连续的数字或者文本进行编号。
|
|
#MSSubClass=The building class all_data['MSSubClass'] = all_data['MSSubClass'].apply(str) #Changing OverallCond into a categorical variable all_data['OverallCond'] = all_data['OverallCond'].astype(str) #Year and month sold are transformed into categorical features. all_data['YrSold'] = all_data['YrSold'].astype(str) all_data['MoSold'] = all_data['MoSold'].astype(str) |
【说明】
apply(str)与astype(str)功能相同,一般前者快于后者。
(11)对类别特征进行编码
这里使用LabelEncoder 对不连续的数字或者文本进行编号。
|
|
from sklearn.preprocessing import LabelEncoder cols = ('FireplaceQu', 'BsmtQual', 'BsmtCond', 'GarageQual', 'GarageCond', 'ExterQual', 'ExterCond','HeatingQC', 'PoolQC', 'KitchenQual', 'BsmtFinType1', 'BsmtFinType2', 'Functional', 'Fence', 'BsmtExposure', 'GarageFinish', 'LandSlope', 'LotShape', 'PavedDrive', 'Street', 'Alley', 'CentralAir', 'MSSubClass', 'OverallCond', 'YrSold', 'MoSold') # process columns, apply LabelEncoder to categorical features for c in cols: lbl = LabelEncoder() lbl.fit(list(all_data[c].values)) all_data[c] = lbl.transform(list(all_data[c].values)) # shape print('Shape all_data: {}'.format(all_data.shape)) |
(12)增加特征
由于区域相关特征对于确定房价非常重要,这里将增加了一个特征,即每个房屋的地下室总面积,一楼和二楼面积之和
|
|
#Adding total sqfootage feature all_data['TotalSF'] = all_data['TotalBsmtSF'] + all_data['1stFlrSF'] + all_data['2ndFlrSF'] |
(13)查看一些特征的歪斜程度
这里主要对一些数值型特征进行分析
|
|
numeric_feats = all_data.dtypes[all_data.dtypes != "object"].index # Check the skew of all numerical features skewed_feats = all_data[numeric_feats].apply(lambda x: skew(x.dropna())).sort_values(ascending=False) print("\nSkew in numerical features: \n") skewness = pd.DataFrame({'Skew' :skewed_feats}) skewness.head(10) |
运行结果
(14)对这些倾斜特征进行box-cox变换
Box-Cox变换是统计建模中常用的一种数据变换,用于连续的响应变量不满足正态分布的情况。Box-Cox变换使线性回归模型满足线性性、独立性、方差齐性以及正态性的同时,又不丢失信息。
使用Box-Cox变换族一般都可以保证将数据进行成功的正态变换,但在二分变量或较少水平的等级变量的情况下,不能成功进行转换,此时,我们可以考虑使用广义线性模型,如LOGUSTICS模型、Johnson转换等.
Box-Cox变换后,残差可以更好的满足正态性、独立性等假设前提,降低了伪回归的概率

其中确定λ是关键,如何确定λ?一般采用最大似然估计来求。该值一般在[-5,5]之间。
一般y分布为左偏(左边比较陡峭),则λ=0;如果y为右偏,取λ>0。
|
|
skewness = skewness[abs(skewness) > 0.75] print("There are {} skewed numerical features to Box Cox transform".format(skewness.shape[0])) from scipy.special import boxcox1p skewed_features = skewness.index lam = 0.15 for feat in skewed_features: #all_data[feat] += 1 all_data[feat] = boxcox1p(all_data[feat], lam) |
(15)得到虚拟分类特征,对标称类别转换为one-hot编码。
|
|
all_data = pd.get_dummies(all_data) print(all_data.shape) |
运行结果:
(2917, 220)
(16)得到新的训练集、测试集
|
|
train = all_data[:ntrain] test = all_data[ntrain:] |
查看他们的维度
|
|
print(train.shape) print(test.shape) |
运行结果
(1458, 220)
(1459, 220)
至此,数据探索及预处理就基本完成,接下来开始创建模型。
18.4.2.2创建模型
(1)导入需要的库
|
|
from sklearn.linear_model import ElasticNet, Lasso, BayesianRidge, LassoLarsIC from sklearn.ensemble import RandomForestRegressor, GradientBoostingRegressor from sklearn.kernel_ridge import KernelRidge from sklearn.pipeline import make_pipeline from sklearn.preprocessing import RobustScaler from sklearn.base import BaseEstimator, TransformerMixin, RegressorMixin, clone from sklearn.model_selection import KFold, cross_val_score, train_test_split from sklearn.metrics import mean_squared_error import xgboost as xgb import lightgbm as lgb |
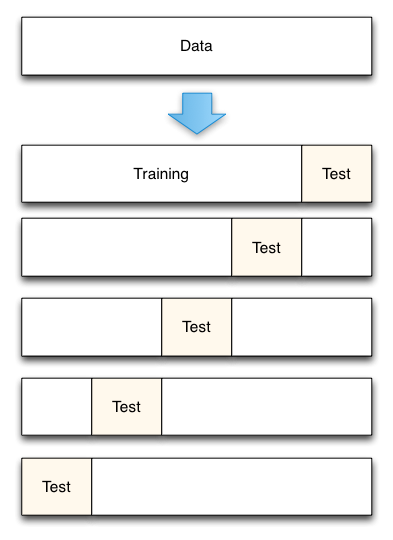
(2)使用K折交叉验证,其中k=5
K折交叉验证简介:
将数据集平均分割成K个等份
使用1份数据作为测试数据,其余作为训练数据
计算测试准确率
使用不同的测试集,重复2、3步骤
对测试准确率做平均,作为对未知数据预测准确率的估计
如下图
|
|
#Validation function n_folds = 5 def rmsle_cv(model): kf = KFold(n_folds, shuffle=True, random_state=42).get_n_splits(train.values) rmse= np.sqrt(-cross_val_score(model, train.values, y_train, scoring="neg_mean_squared_error", cv = kf)) return(rmse) |
【说明】
# 这里的cross_val_score将交叉验证的整个过程连接起来,不用再进行手动的分割数据
# cv参数用于规定将原始数据分成多少份
# scoring:该参数来控制它们对 estimators evaluated (评估的估计量)应用的指标。
对分类模型,该值可以为‘accuracy’ 或‘f1’;对回归模型,可以为‘explained_variance’, ‘neg_mean_squared_error’等。对性能来说,越小越好,最佳为0.
#多种评估指标:回归模型
均方差(MSE):

均方误差对数(MSLE):

平均绝对误差(MAE):

更多模型评估指标,可参考:http://sklearn.apachecn.org/cn/0.19.0/modules/model_evaluation.html
(3)使用模型
在模型选择上,“没有免费的午餐”。为了比较模型间的性能,这里使用多种模型。首先使用3 种回归模型(Linear Regression,Lasso,Ridge。
使用LASSO Regression :
该模型可能对异常值非常敏感。 所以我们需要让它们更加健壮。 为此,我们在管道上使用sklearn的Robustscaler()方法。
|
|
lasso = make_pipeline(RobustScaler(), Lasso(alpha =0.0005, random_state=1)) |
使用Elastic Net Regression :
增益对异常值有所增强,故这里也使用Robustscaler()方法
|
|
ENet = make_pipeline(RobustScaler(), ElasticNet(alpha=0.0005, l1_ratio=.9, random_state=3)) |
【ElasticNet简介】
ElasticNet 是一种使用L1和L2先验作为正则化矩阵的线性回归模型.这种组合用于只有很少的权重非零的稀疏模型,比如:class:Lasso, 但是又能保持:class:Ridge 的正则化属性.我们可以使用ρ(ρ的具体位置,请看下面这个表达式)参数来调节L1和L2的凸组合(一类特殊的线性组合)。
当多个特征和另一个特征相关的时候弹性网络非常有用。Lasso 倾向于随机选择其中一个,而弹性网络更倾向于选择两个.
在实践中,Lasso 和 Ridge 之间权衡的一个优势是它允许在循环过程(Under rotate)中继承 Ridge 的稳定性.
弹性网络的目标函数是最小化:

ElasticNetCV 可以通过交叉验证来用来设置参数:
alpha (α),l1_ratio (ρ)
使用Kernel Ridge Regression :
|
|
KRR = KernelRidge(alpha=0.6, kernel='polynomial', degree=2, coef0=2.5) |
使用Gradient Boosting Regression :
其对异常值具有鲁棒性
|
|
GBoost = GradientBoostingRegressor(n_estimators=3000, learning_rate=0.05, max_depth=4, max_features='sqrt', min_samples_leaf=15, min_samples_split=10, loss='huber', random_state =5) |
使用XGBoost :
|
|
model_xgb = xgb.XGBRegressor(colsample_bytree=0.4603, gamma=0.0468, learning_rate=0.05, max_depth=3, min_child_weight=1.7817, n_estimators=2200, reg_alpha=0.4640, reg_lambda=0.8571, subsample=0.5213, silent=1, random_state =7, nthread = -1) |
使用LightGBM
|
|
model_lgb = lgb.LGBMRegressor(objective='regression',num_leaves=5, learning_rate=0.05, n_estimators=720, max_bin = 55, bagging_fraction = 0.8, bagging_freq = 5, feature_fraction = 0.2319, feature_fraction_seed=9, bagging_seed=9, min_data_in_leaf =6, min_sum_hessian_in_leaf = 11) |
18.4.2.3看各模型的性能
让我们通过评估交叉验证rmsle错误来了解这些基本模型如何对数据执行
1 2 3 4 5 6 7 8 9 10 11 12 13 14 15 16 17 |
score = rmsle_cv(lasso) print("\nLasso score: {:.4f} ({:.4f})\n".format(score.mean(), score.std())) score = rmsle_cv(ENet) print("ElasticNet score: {:.4f} ({:.4f})\n".format(score.mean(), score.std())) score = rmsle_cv(KRR) print("Kernel Ridge score: {:.4f} ({:.4f})\n".format(score.mean(), score.std())) score = rmsle_cv(GBoost) print("Gradient Boosting score: {:.4f} ({:.4f})\n".format(score.mean(), score.std())) score = rmsle_cv(model_xgb) print("Xgboost score: {:.4f} ({:.4f})\n".format(score.mean(), score.std())) score = rmsle_cv(model_lgb) print("LGBM score: {:.4f} ({:.4f})\n" .format(score.mean(), score.std())) |
运行结果
Lasso score: 0.0032 (0.0002)
ElasticNet score: 0.0031 (0.0002)
Kernel Ridge score: 0.0034 (0.0004)
Gradient Boosting score: 0.0026 (0.0002)
Xgboost score: 0.0086 (0.0003)
LGBM score: 0.0026 (0.0002)
18.4.2.4堆叠(或集成)各模型
我们从这种平均基本模型的简单方法开始。 我们构建了一个新类来扩展scikit-learn与我们的模型,并且还包括封装和代码重用(继承)
(1)对各模型求平均值
1 2 3 4 5 6 7 8 9 10 11 12 13 14 15 16 17 18 19 20 |
class AveragingModels(BaseEstimator, RegressorMixin, TransformerMixin): def __init__(self, models): self.models = models # we define clones of the original models to fit the data in def fit(self, X, y): self.models_ = [clone(x) for x in self.models] # Train cloned base models for model in self.models_: model.fit(X, y) return self #Now we do the predictions for cloned models and average them def predict(self, X): predictions = np.column_stack([ model.predict(X) for model in self.models_ ]) return np.mean(predictions, axis=1) |
(2)看集成后模型性能
这里集成ENet, GBoost, KRR, lasso这4种基本模型
|
|
averaged_models = AveragingModels(models = (ENet, GBoost, KRR, lasso)) score = rmsle_cv(averaged_models) print(" Averaged base models score: {:.4f} ({:.4f})\n".format(score.mean(), score.std())) |
运行结果
Averaged base models score: 0.0027 (0.0002)
不错!从初步结果来看,上面我们采用的最简单的堆叠方法确实提高了分数。 这将鼓励我们进一步探索不那么简单的堆叠方法。
18.4.2.5添加元模型
这种集成方法的基本思想如下:
在这种方法中,我们在平均基础模型上添加元模型,并使用这些基础模型的折叠后预测来训练我们的元模型。
培训部分的程序可以描述如下:
1)将整个训练集分成两个不相交的集(这里是train和holdout)
2)在第一部分(即train)训练几个基础模型
3)在第二部分(即holdout)测试这些基础模型
4)使用来自3)的预测(称为折叠外预测)作为输入,并使用正确的响应(目标变量)作为输出来训练更高级别的元模型。
前三个步骤是迭代完成的。 如果我们采用5-折(5-fold)堆叠,我们首先将训练数据分成5折(fold)。 然后我们将进行5次迭代。 在每次迭代中,我们训练每个基础模型4份并在剩余的一份数据上进行预测。
因此,经过5次迭代后,我们将确保使用整个数据进行折叠后预测,然后我们将使用这些预测作为新特征来训练第4步中的元模型。
对于预测部分,我们对测试数据上所有基础模型的预测进行平均,并将它们用作元特征,最终预测是使用元模型完成的。
以上步骤如下图所示:

数据生成过程的动态效果图:

有关stacking的介绍可参考:
http://blog.kaggle.com/2017/06/15/stacking-made-easy-an-introduction-to-stacknet-by-competitions-grandmaster-marios-michailidis-kazanova/
此外,下图从另一个角度来说明stacking的原理。
改为如下图(主要把上部分的列标题都为Model1)

如何理解这个图呢?我们通过一个简单实例来说明:
Train Data有890行。(请对应图中的上层部分)
每1次的fold,都会生成 712行 小train, 178行 小test。我们用Model 1来训练 712行的小train,然后预测 178行 小test。预测的结果是长度为 178 的预测值。
这样的动作走5次! 长度为178 的预测值 X 5 = 890 预测值,刚好和Train data长度吻合。这个890预测值是Model 1产生的,我们先存着,因为,一会让它将是第二层模型的训练来源。
重点:这一步产生的预测值我们可以转成 890 X 1 (890 行,1列),记作 P1 (大写P)
接着说 Test Data 有 418 行。(请对应图中的下层部分,对对对,绿绿的那些框框)
每1次的fold,712行 小train训练出来的Model 1要去预测我们全部的Test Data(全部!因为Test Data没有加入5-fold,所以每次都是全部!)。此时,Model 1的预测结果是长度为418的预测值。
这样的动作走5次!我们可以得到一个 5 X 418 的预测值矩阵。然后我们根据行来就平均值,最后得到一个 1 X 418 的平均预测值。
重点:这一步产生的预测值我们可以转成 418 X 1 (418行,1列),记作 p1 (小写p)
走到这里,你的第一层的Model 1完成了它的使命。
第一层还会有其他Model的,比如Model 2,同样的走一遍, 我们有可以得到 890 X 1 (P2) 和 418 X 1 (p2) 列预测值。
这样吧,假设你第一层有3个模型,这样你就会得到:
来自5-fold的预测值矩阵 890 X 3,(P1,P2, P3) 和 来自Test Data预测值矩阵 418 X 3, (p1, p2, p3)。
到第二层了
来自5-fold的预测值矩阵 890 X 3 作为你的Train Data,训练第二层的模型
来自Test Data预测值矩阵 418 X 3 就是你的Test Data,用训练好的模型来预测他们吧。
(1)堆叠平均模型类
1 2 3 4 5 6 7 8 9 10 11 12 13 14 15 16 17 18 19 20 21 22 23 24 25 26 27 28 29 30 31 32 33 34 |
class StackingAveragedModels(BaseEstimator, RegressorMixin, TransformerMixin): def __init__(self, base_models, meta_model, n_folds=5): self.base_models = base_models self.meta_model = meta_model self.n_folds = n_folds # We again fit the data on clones of the original models def fit(self, X, y): self.base_models_ = [list() for x in self.base_models] self.meta_model_ = clone(self.meta_model) kfold = KFold(n_splits=self.n_folds, shuffle=True, random_state=156) # Train cloned base models then create out-of-fold predictions # that are needed to train the cloned meta-model out_of_fold_predictions = np.zeros((X.shape[0], len(self.base_models))) for i, model in enumerate(self.base_models): for train_index, holdout_index in kfold.split(X, y): instance = clone(model) self.base_models_[i].append(instance) instance.fit(X[train_index], y[train_index]) y_pred = instance.predict(X[holdout_index]) out_of_fold_predictions[holdout_index, i] = y_pred # Now train the cloned meta-model using the out-of-fold predictions as new feature self.meta_model_.fit(out_of_fold_predictions, y) return self #Do the predictions of all base models on the test data and use the averaged predictions as #meta-features for the final prediction which is done by the meta-model def predict(self, X): meta_features = np.column_stack([ np.column_stack([model.predict(X) for model in base_models]).mean(axis=1) for base_models in self.base_models_ ]) return self.meta_model_.predict(meta_features) |
(2)堆叠平均模型得分
为了使两种方法具有可比性(通过使用相同数量的模型),我们只是平均Enet,KRR和Gboost,然后我们添加lasso作为元模型。
|
|
stacked_averaged_models = StackingAveragedModels(base_models = (ENet, GBoost, KRR), meta_model = lasso) score = rmsle_cv(stacked_averaged_models) print("Stacking Averaged models score: {:.4f} ({:.4f})".format(score.mean(), score.std())) |
运行结果
Stacking Averaged models score: 0.0026 (0.0002)
由此可知,通过添加元学习器,我们再次获得更好的分数。
这个结果比简单求平均值的得分Averaged base models score: 0.0027 (0.0002)
更好!
(3)集成StackedRegressor,XGBoost和LightGBM
我们将XGBoost和LightGBM添加到之前定义的StackedRegressor中。
我们首先定义一个rmsle评估函数
|
|
def rmsle(y, y_pred): return np.sqrt(mean_squared_error(y, y_pred)) |
(4)最终培训和预测
|
|
stacked_averaged_models.fit(train.values, y_train) stacked_train_pred = stacked_averaged_models.predict(train.values) stacked_pred = np.expm1(stacked_averaged_models.predict(test.values)) print(rmsle(y_train, stacked_train_pred)) |
运行结果
0.00165651517208
(5)计算xgboost
|
|
model_xgb.fit(train, y_train) xgb_train_pred = model_xgb.predict(train) xgb_pred = np.expm1(model_xgb.predict(test)) print(rmsle(y_train, xgb_train_pred)) |
运行结果
0.00860202560688
(6)计算LightGBM:
|
|
model_lgb.fit(train, y_train) lgb_train_pred = model_lgb.predict(train) lgb_pred = np.expm1(model_lgb.predict(test.values)) print(rmsle(y_train, lgb_train_pred)) |
运行结果
0.0016023894136
|
|
'''RMSE on the entire Train data when averaging''' print('RMSLE score on train data:') print(rmsle(y_train,stacked_train_pred*0.70 + xgb_train_pred*0.15 + lgb_train_pred*0.15 )) |
运行结果
RMSLE score on train data:
0.002334422609
由此看出,这似乎最简单的堆叠(或集成)方法确实提高了分数。
大家可参考:https://www.kaggle.com/serigne/stacked-regressions-top-4-on-leaderboard
集成学习非常成功,该算法不仅在挑战性的数据集上频频打破性能方面的记录,而且是 Kaggle 数据科学竞赛的获奖者常用的方法之一。
有关集成学习方法可参考:
https://zhuanlan.zhihu.com/p/25836678



















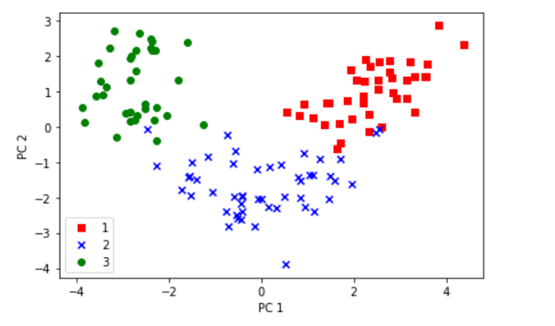
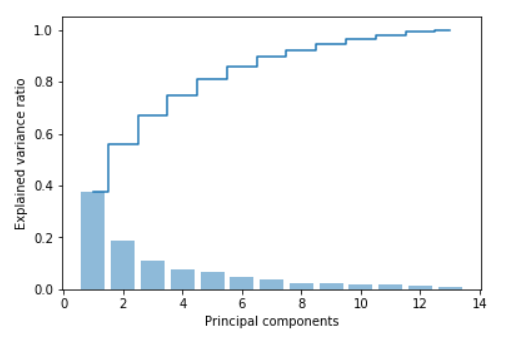
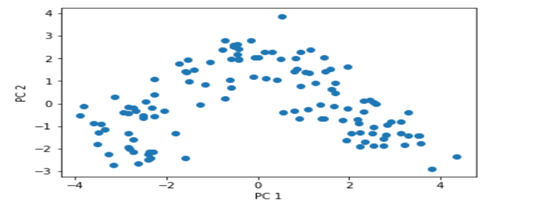
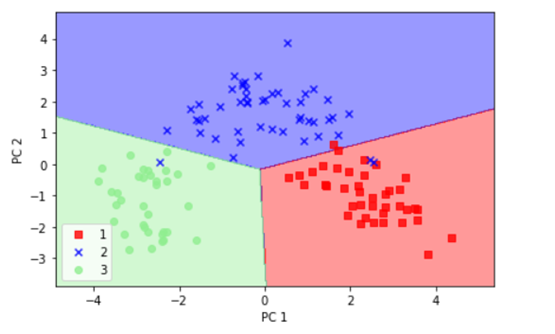


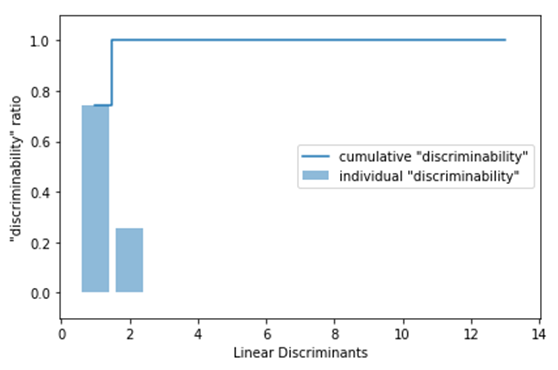
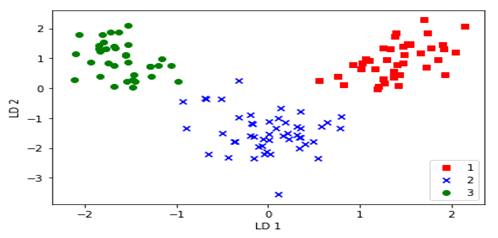

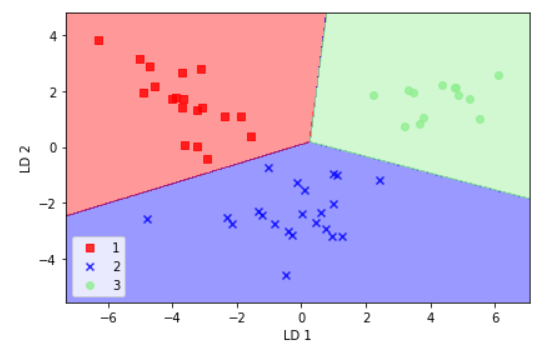
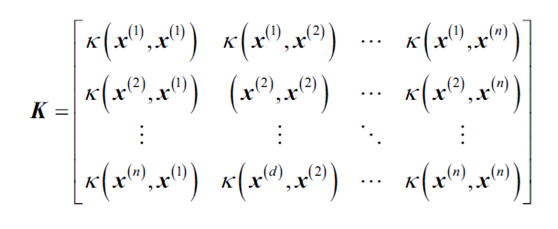

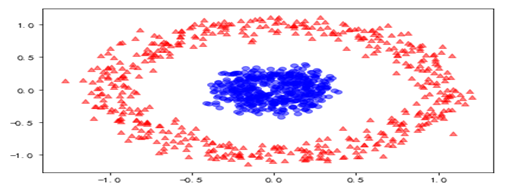
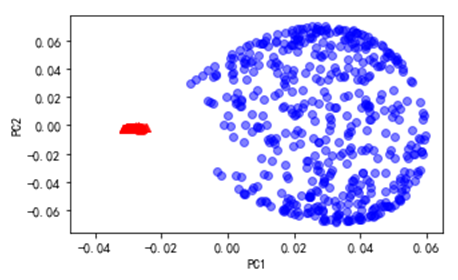
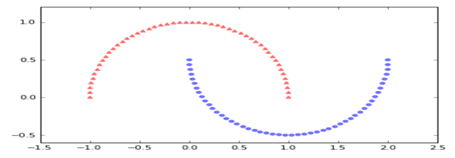
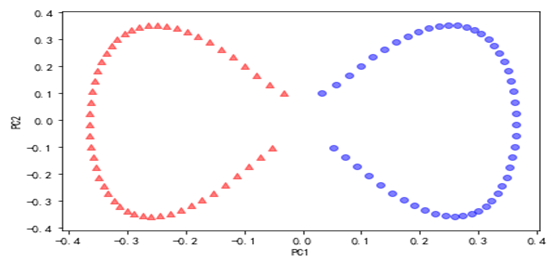


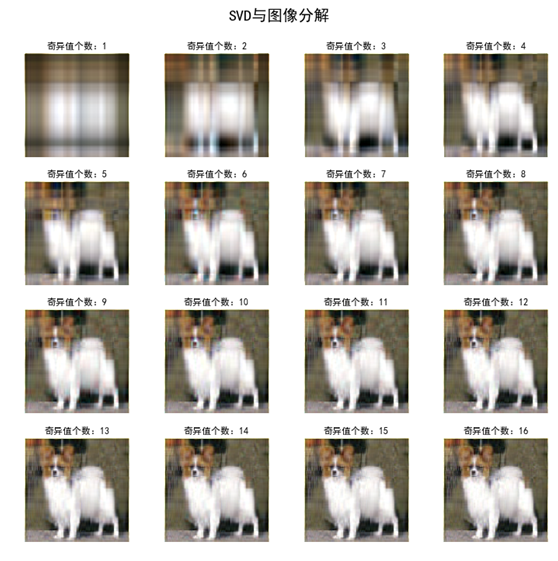
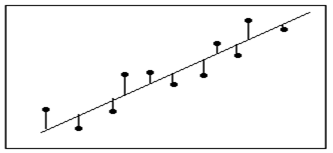
 对这些数据可视化结果如下: